Description
PLEASE READ. Submit paper copies of your solutions on January 23th 2018 in class. For codes, print them out. You are encouraged to discuss in groups (two people for each group), but please complete your programming and writeup individually. Indicate the name of your collaborator in your writeup.
Problem 1. Consider the following neural network:
h1 = W1X + b1 a1 = sigmoid(h1) h2 = W2a1 + b2 a2 = tanh(h2) o = W3a2 + b3 p = softmax(o)
softmax(oi) =
eoi PK j=0 eoj
for i in {0,1,…,K}
where, hn denote the hidden layers, an denotes the activation layers, Wn are the weights, X being the input to the neural network, o denotes the output layer and p denotes the predicted probabilities. The cross-entropy loss is used as the loss function and is given by: L = − X for all class c yc log(pc) where y is the target labels (one-hot vector, i.e., the yc = 1 if the label of the instance is c). Compute the derivative of the cross-entropy loss L w.r.t o, i.e compute ∂L ∂o . (25 marks)
Problem 2. Draw the computational graph of the network described in Problem 1. Using the derivative calculated in the previous question, perform Backpropagation to compute the gradients of loss L w.r.t all the weights and biases, i.e compute ∂L ∂W1 , ∂L ∂W2 , ∂L ∂W3 , ∂L ∂b1 , ∂L ∂b2 , ∂L ∂b3 . (25 marks)
Problem 3. Batch Normalization is a technique that forces the input to any layer to be zero mean and unit standard deviation. Below is the algorithm from the paper (Refer:
1
https://arxiv.org/pdf/1502.03167.pdf), Using the algorithm, draw the computational graph of the batchnorm layer. Consider a function F(yi) and compute the derivatives of F(yi) w.r.t x, γ and β, i.e compute ∂F ∂γ , ∂F ∂β , ∂F ∂x . Assume ∂F ∂yi is given. (25 marks)
Problem 4. Consider the MNIST dataset. It consists of 10 class labels (0-9) and has 60,000 training images and 10,000 test images.
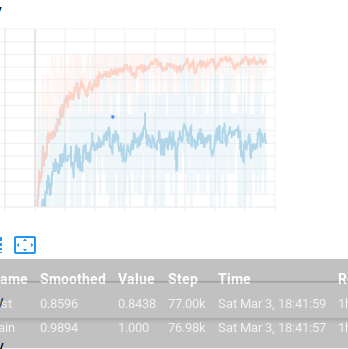
1. Construct a model using fully connected layers (at least 3 layers or more!) and ReLu layers to solve this classification problem using Tensorflow. Report the accuracy obtained on the test set. Plot a graph demonstrating how the loss function decreases over the number of iterations. (5 marks)
2. Add batch normalization layers in the model. Report the accuracy obtained and plot a graph showing how loss decreases. Elaborate briefly on how and why batch normalization helped. (5 marks)
3. For the same dataset, train a Convolutional Neural Network (with and without batchnorm). Try experimenting with different architectures (different optimizers, number of convolutional layers, etc) and report the accuracy that you obtained with both using and without using batchnorm. Plot the loss vs iterations graph and explain why and how batch normalization helped. (15 marks)


